GrassGro Downloads
GrassGro Application
GrassGro can be downloaded from CSIRO. The download link is on this page.
Download these Libraries to your main GrassGro directory on your hard drive and Import their contents into the appropriate GrassGro Library (Issues, Farm System, Acceptability Reports or Components Libraries).
| Reports |
1. Drought lot feeding report showing detail about the animal in the feedlot during drought periods.
2. Chilling values and summary of time over chill index thresholds.
Download: acceptability_reports.zip
To install these Reports: 1) Unzip this file. 2) Open the Acceptability Reports library. 3) Choose the import option and select each file in turn. 4) Save your library.
| Issues |
For version 3
- Feeding management and costs
- Test different levels of starting soil moisture on the seasonal outlook at several stocking rates (Tactical Issue with report): Click here
To install these Issues: 1) Open the Issues library window. 2) Click on the Import button on the middle toolbar on this window. 3) Select the file you just downloaded. 4) Save your Issues library.
| Farm Systems |
- Merino ewes grazing dual-purpose cereal crop in winter
- Wethers grazing crop stubble over summer (and description)
To import these Farm systems: 1) From the Farm system library tree, right click on the top item and choose Import. 2) Select the file you just downloaded. 3) You will now have a new Farm system in your library.
| Components |
For version 3.1
- Historic supplement costs used in beef and sheep enterprises. This library item contains the same supplement costs as the example one in the standard library, but also includes some beef enterprise costs.
- Sheep sale prices scaled on a monthly basis. This library item includes the monthly variation of sale prices that are shown to be significant especially for C.F.A. animals. (Source: Phil Graham)
To import these items: 1) From your custom Component Library, right click on the folder that is the same type as the item you want to import. 2) Choose the Import option.
Seasonal Outlook -updates
“How do current seasonal conditions compare with previous seasons?”
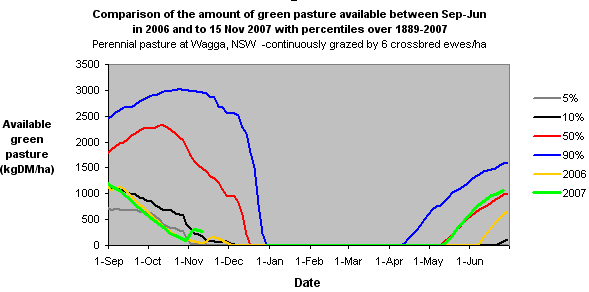
The graph (Note: The graphs below are a manual amalgamation of outputs from GrassGro) below shows results from historical GrassGro simulations from 1889 to 2006 of a grazed perennial pasture at Wagga NSW. The blue, red, black and grey lines show percentile rankings for pasture availability for a particular time of year. For example, in the “best” 10% of seasons the amount of pasture on a specific date exceeded the blue line at the top (the 90th percentile). In the worst 10% of seasons the amount of green pasture was less than the black line at the bottom. The percentile lines show rankings for specific dates and do not represent pasture availability for any one year. In contrast, the simulated outcome for an “actual” year (2006) is shown by the yellow line and the results to November 2007 are shown by the green line.
This analysis suggests that the amounts of green pasture in November 2006 and 2007 are around or below the 10th percentile (black line).
“Given current seasonal conditions, how much pasture can I expect between now and the end of June next year?”
- Seasonal Outlook at Wagga Wagga, NSW -updated 15 Nov 2007
Downloads for this analysis:
- Report (PDF)
- Farm System file and Analysis file. Right click on a link and choose “Save Target As” from the menu. Next Save the file to your GrassGro directory and open it in GrassGro.
- Note: To run this anlaysis in GrassGro you must purchase SILO weather data from https://silo.longpaddock.qld.gov.au/
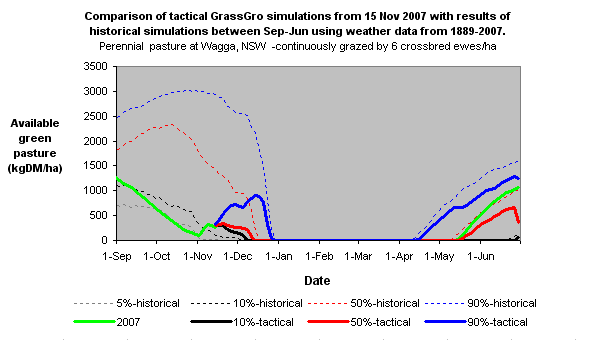
Notes on the GrassGro Seasonal Outlook analysis report: This PDF document compares graphs from historical and tactical analyses in GrassGro simulated using 118 years of weather data (1889-2007 -SILO Patched Point weather dataset).
The historical analysis shows the distribution of green pasture supply simulated chronologically from 1 Jan 1889 to 15 Nov 2007.
The tactical analysis starts on 15 Nov 2007, with soil, pasture and livestock conditions as simulated up to that date. Using this one set of starting conditions, the period 15 Nov-30 June is then simulated using weather from each of the 118 years. Distributions of green pasture availability between August and June are shown as percentile charts.
Results from the previous seasonal analyses (from 15 Oct, 22 Sep and 28 Aug 2007) are also shown.
Results are indicative only and are specific for the inputs used in the GrassGro analysis, which do not refer to a real farm in this case.